A far-fetched goal I have is using sketching on a whiteboard as a way to define programs. I mean formal programs that you can execute. Of course through your sketches you would define programs in a high level domain specific language, for example describing a state machine or an Entity-Relationship diagram.
To do so I would like to start recognizing rectangles. Then I will move to recognize other shapes, connecting lines and recognizing text present in the diagram. For now let’s focus on recognizing rectangles.
My general approach would be the following:
- recognize the meaningful lines
- recognize key points among those lines
- classify those key points using AI
- find shapes by combining the classified key points
Ok. This is not going to be something I complete over a week-end.
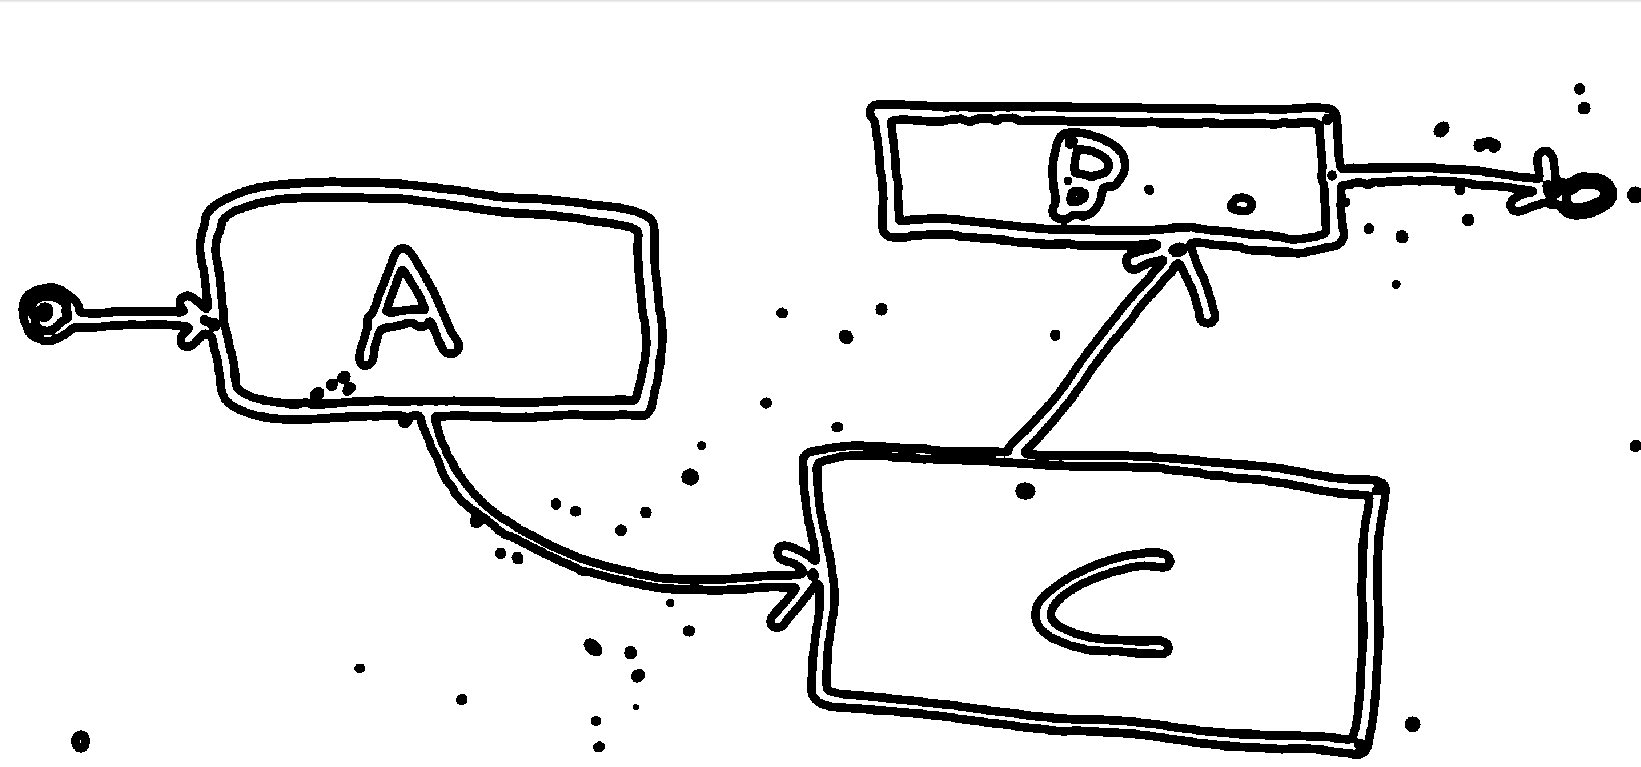
The input images
We will use 3 images: two have them have been drawn on a whiteboard by me, under different light conditions. The third one was found on the Internet. It has the particularity that the sketch was done on a graph paper (i.e., there is a grid on the paper).
-

- Whiteboard (natural light)
-

- Whiteboard (artificial light)
-

- Graph paper
Let’s see how we can process these images. We will use Java and the BoofCV image processing library.
Gray scale
As first thing we convert the image to gray scale. Here we get a problem with the image taken under artificial light:

We want to remove that giant gray blob on bottom right corner. To do so we will use derivatives.
Derivatives
We blur the image, to reduce the effect of noise and calculate the derivates. This is a way to capture the sharp variations of colors which happens vertically or horizontally.
We would got something like this for the image taken under natural light:
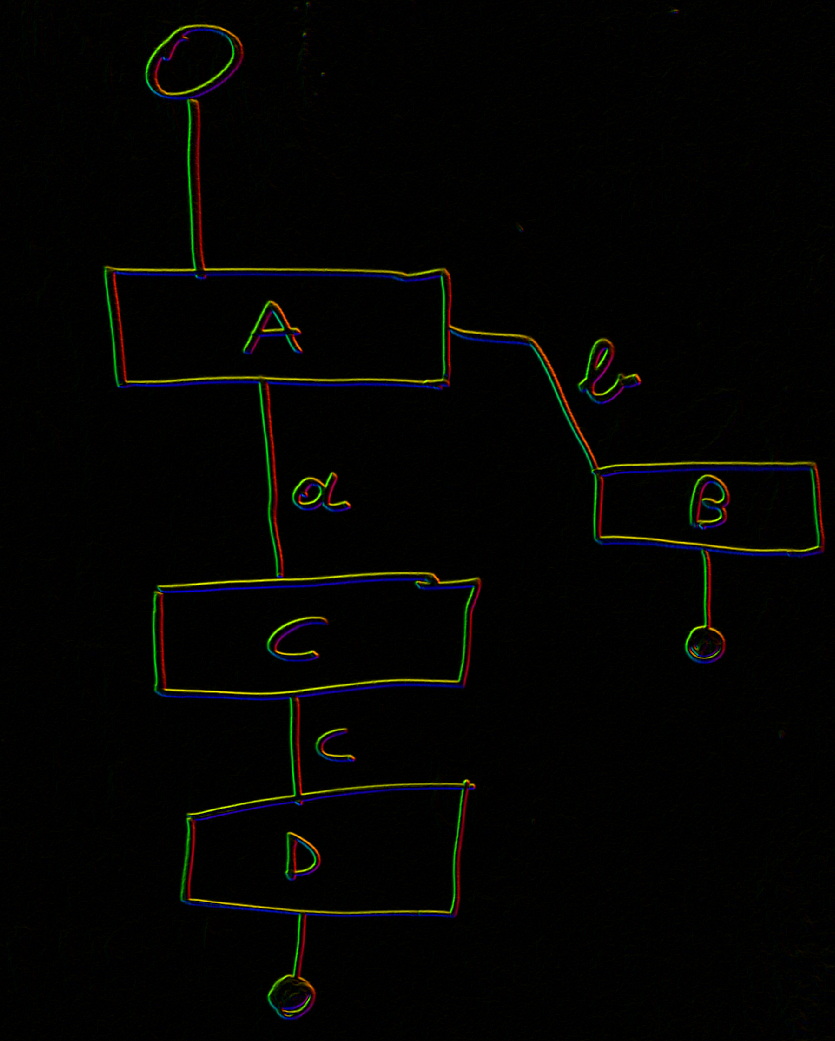
However for the image taken under artificial light we see the noise:

At this point we take each point of image and look if around it there is an high number of points with an high derivative (either horizontal or vertical). We keep the points satisfying the condition and we set all the other points to white. We do that a couple of times.
This is the result:
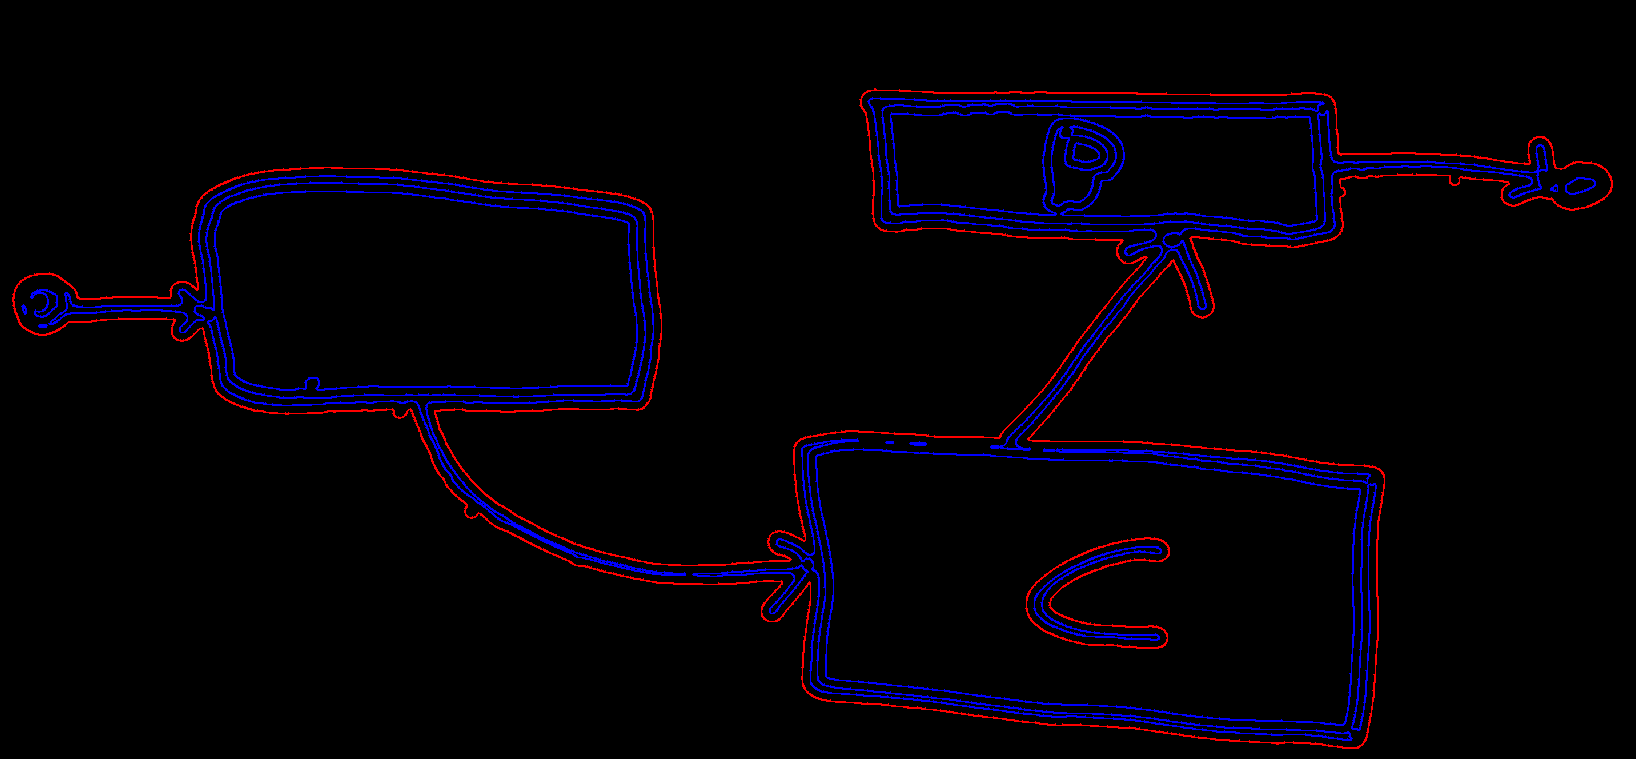
Contours
We do some additional filtering and then we invoke a function to find the contours inside the image. We draw the external contours in red and the internal ones in blue.
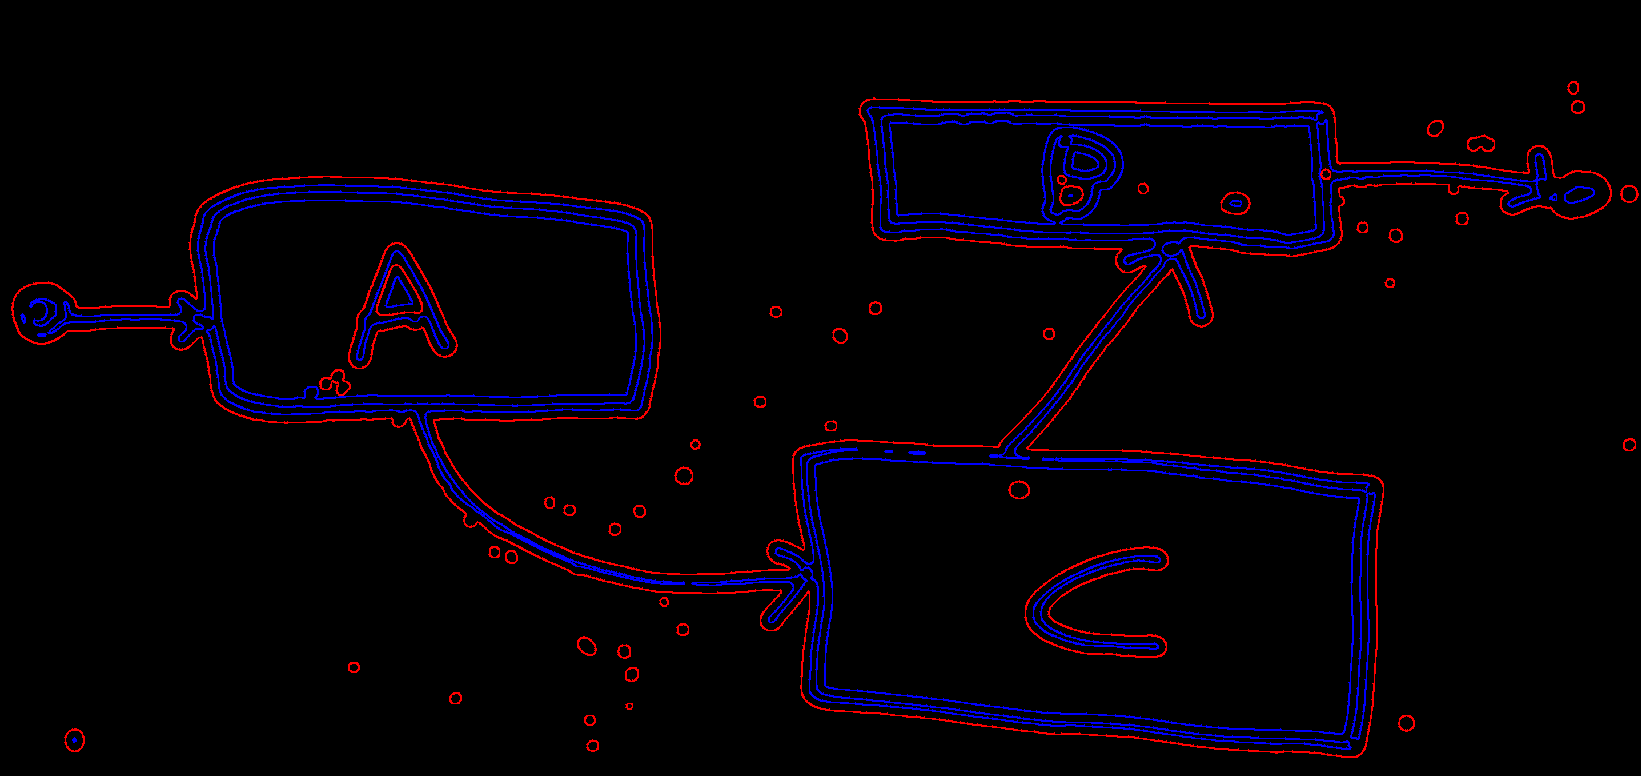
We then remove the short contours
Key points
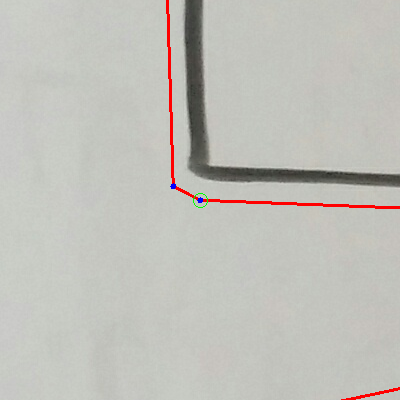
The contours we get are drawn as a list of segments which are very short. Let’s draw the extremes of the segments in blue.
Yes, they are very short: you just see a continuous set of extremes, very close one to each other. We want to get much less segments and much longer.
To do that we use basically two strategies:
- we simply merge consecutive extremes which are very close
- we take sequences of three consecutive points: A, B, C. If B is very close to the line between A and C we just remove B
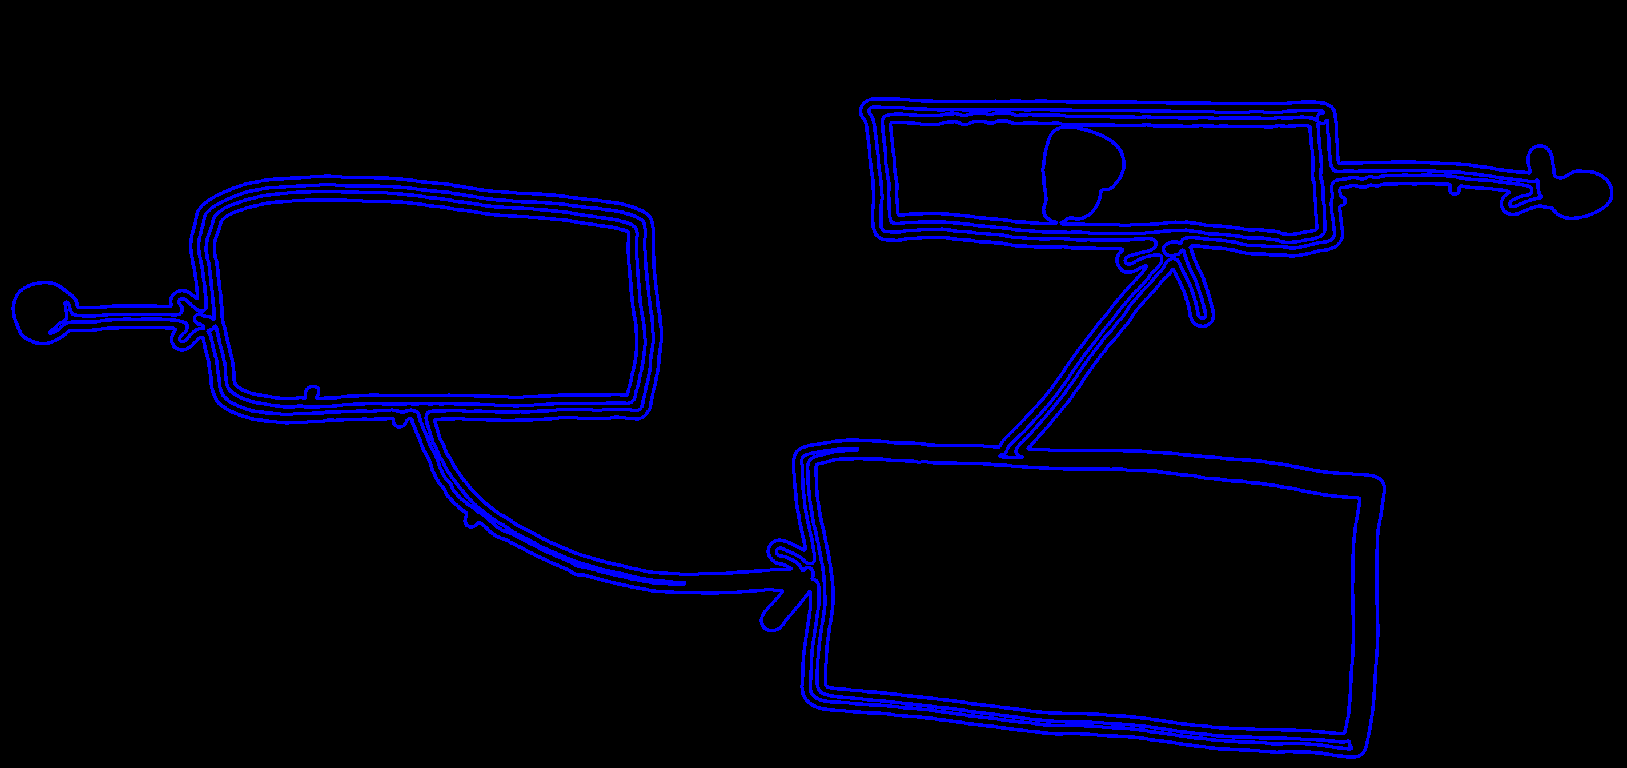
We apply two times both these strategies and get much simpler contours. This is the final results.


What next
Now we have a reasonable number of relevant points. I want to now proceed to classify them through machine learning techniques. For example I want to recognize single points to be a top left corner of a rectangle or points part of an arrow. Then I will proceed to combine those recognized points to obtain entire shapes (my rectangles!).
Right now I am already generating the images to classify and I am thinking about which features to use for machine learning. I have some ideas, but we will see them in one of next posts.
Training images looks like this: