
The code for this article is on GitHub: PDFToExcel
In this article we are going to see how to extract tables trapped into PDF files and put them in Excel files. This way you can easily work with the data: you can process it, analyze it, and use it to take decisions. We are going to see that you do not need developers for this process, but sysadmins. Thanks to competent and knowledgeable sysadmins you will be able to reliably extract tables from textual PDF, but you will get mediocre results, at best, with PDF made of images.
In the companion repository you will find the basic script we created for this article, together with the example PDFs we used.
You Need More than a Parser for That
Parsing is a process that can be interesting in itself, but it is rarely the end objective of a software. You build or use a parser to accomplish something else.
The purpose of parsing is to free the data from its original format and use it for something useful.
In fact, often the parsing is the easy part, while understanding the parsed data is harder to do perfectly. For instance, in our library SmartReader we use an HTML parser to try to isolate the main content of a web page. Now, parsing HTML can be messy, but it is always more reliable than trying to remove ads, sidebars, etc. from a web page.
This is the difference between syntactic analysis (i.e., parsing) and semantic analysis (i.e., understanding). There are general rules to parse something, but to process it in a meaningful way you need some in-depth knowledge of the topic at hand. However, this technical difference is lost on many, so it is not surprising that some clients have written us asking to build parsers for things like addresses. We can create this kind of software, too, although we do not use traditional parsers to do that.
Something that people have also asked us is to convert tables in PDF to Excel files, which is the topic of this article.
From a business perspective it is easy to understand why people would want to do this: the world runs on Excel (even when there are better solutions like Domain Specific Languages). So, businesses needs an easy way to convert data from PDF files to a format in which their analysts can work with. Plus, when you get data in Excel you can easily transform it into something else. Let’s see how we can do this.
The Problem with PDFs
PDF is a wonderful format for what is designed: to faithfully reproduce a document in the same way on all platforms. This is an hard task to accomplish. This can be attested as anybody that have tried to open the same office document with Microsoft Office on Windows and MacOS. Even the same document opened with the same software can be slightly different on different OSes.
So, this is no small feat at all. However, the issue is that to accomplish that you need a format with simple primitives and no structured information. This means that in a PDF file there is no equivalent of a <table> element: a table is created with simple lines and visual clues like colored backgrounds. Basically, in PDF tables are drawn like images. Therefore to detect a table we are forced to use a fuzzy process. We need to reason about stuff like the shapes of polygons, the position of text, the relationship between lines and text, etc.
In some cases we have it even worse: for example when a PDF is just a digital image or the scanning of a file that was printed. Then we have even to battle with distorted lines and no textual elements at all. The whole endeavor seems desperate, but as we are going to see, sometimes we can actually extract information from these PDF files, too.
In short, there are two types of PDFs containing tables:
- with textual data
- with scanned images
Let’s see how we can extract tables from PDF of both types.
Methods to Detect Tables in Textual PDFs
We are going to start to look at textual PDFs first, since these files provide the foundation to analyze all types of PDFs. There are mainly two techniques used to detect tables: Stream and Lattice. These methods were developed and refined by a few tools. We will use Camelot, but the origin of these names is from Tabula.
The documentation of Camelot provides all the info you need in the section How It Works. Here we provide a summary.
Stream
Stream can be used to parse tables that have whitespaces between cells to simulate a table structure. It is built on top of PDFMiner’s functionality of grouping characters on a page into words and sentences, using margins.
This method works roughly as follows:
- rows are detected (i.e., guessed) based on the y-axis position (i.e., height) of some text. Basically, all text is on the same line is considered to be part of the same row
- text is grouped in columns according to some heuristics. In a PDF each word is in its own box, so basically words are put in the same group if they are close and then columns are detected depending on the distance between groups of words
- the table is put together based on the rows and columns detected at earlier steps
Lattice
Lattice is more deterministic in nature, and it does not rely on guesses. It can be used to parse tables that have demarcated lines between cells, and it can automatically parse multiple tables present on a page.
Lattice essentially works by looking at the shape of polygons and getting the text inside of the boxes. This would be easy enough if a PDF had the concept of a polygon. If it had, it would probably have a method to understand what is inside of it. However, it does not. So, the solution is to use a computer vision library like OpenCV to perform roughly this procedure:
- lines are detected
- intersections between lines are detected by looking at the intensity of the pixels of all lines. If a pixel of a line has more intensity than the rest of the pixel it is part of two lines and therefore an intersection
- the boundaries of the table are found by looking at the intensity of the pixels of overlapped lines. This time all the pixels of a line are taken and the most external lines represent the boundaries of the table
- the image analysis is translated into the PDF coordinates, where the cells are determined
- the text is assigned to a cell
How to Detect Tables in PDF with Scanned Images
It might might seem impossible to detect tables in scanned images: there is no text in an image, hence there cannot be a table either. While it is true that an image is not textual data, it could represent text. So, if we want to have some hope of finding a table, we must first detect and extract any text contained in the image. Luckily we can actually extract textual information from an image, using OCR techniques, Optical Character Recognition.
This is the first step: we try to detect text with OCR software. The best open-source software for this task is Tesseract, so that is the one used by the software we chose to analyze images. OCR has improved a lot from its clunky origins. Some commercial software can even recognize your own handwriting (after some training). Tesseract is not quite there yet, but it generally works well enough for some needs.
The PDF Format Has a Secret
Once we have detected all the text we can get from the PDF, we have a new problem. We have gained some text, but we have also lost all information about the position of the text, so we have no chance to understand whether there is a table or not. That would be bad. However, this time the PDF format is helpful, in that it allows to precisely annotate an image.
Basically we can hide inside the PDF the text found by OCR in the exact position in which it appears in the image. This feature is also used to copy-and-paste from PDF containing scanned images.
Let’s see an example of a PDF containing a scanned image that has been annotated with text detected by OCR software. The original PDF had no text in it. In the following image all the text in the PDF has been selected. This is the content that you could paste manually somewhere else.
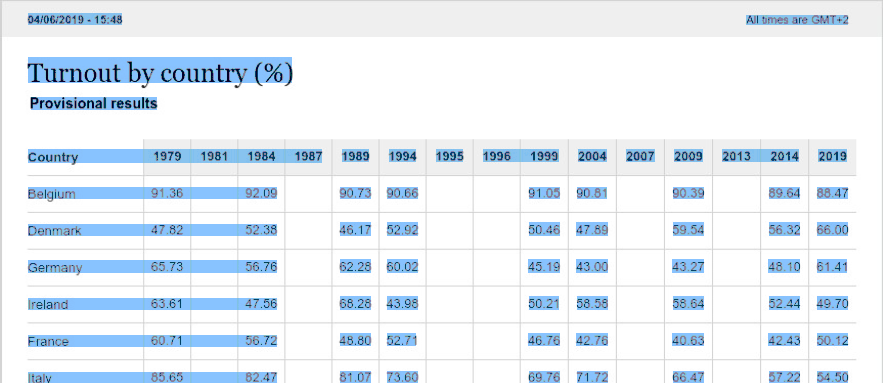
Now let’s compare that result with the text found directly in a textual PDF. Also in this image the text has been selected.
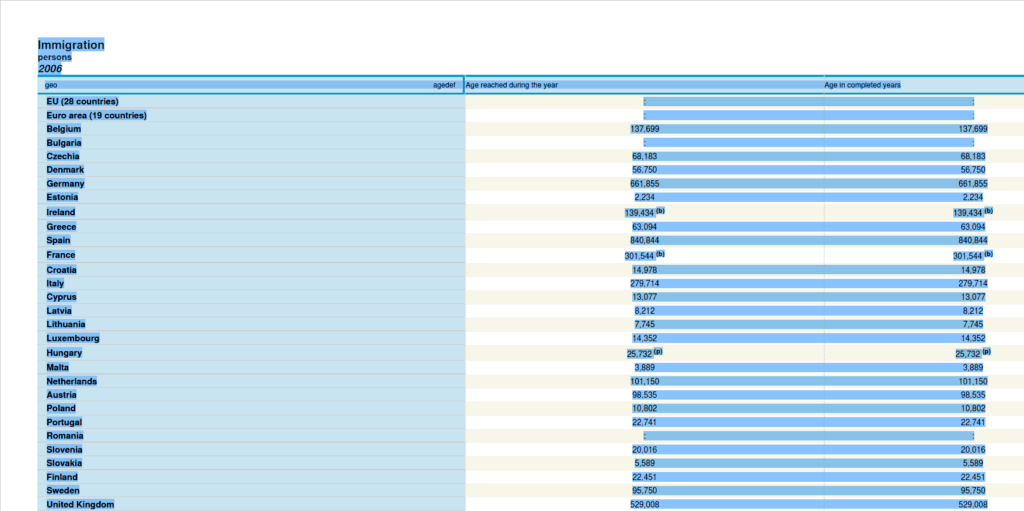
As you can see the organization of the text looks fairly similar.
How Can We Do That?
All we have to do is to put back the text inside the PDF. Then we will have a textual PDF on which to use the methods learned in the previous section. We would not be able to use the Lattice method, but we could use the Stream one and look at whitespace to detect any table.
There is a software that could do all of that: both use OCR to get the text in the PDF and annotate the PDF with the textual information. It is called OCRmyPDF. It is designed to annotate an image PDF to make it searchable, but it works for our task too.
Now we have a general idea of how the whole process will will work, so we can start looking at some results.
It’s a Job for Sysadmins
As you probably guessed by now, you do not really need developers for this. To have a process that is robust and suited to your business needs you want a sysadmin.
You need somebody that has in-depth knowledge of what PDFs you work with it, how your organization works and how to put together some code. Now, we are not sysadmins, and we are certainly not your sysadmins. However, we can help you to understand how all of this will work.
The main software we are going to use are Camelot and OCRmyPDF, which are both written in Python. The first one works on all major desktop OSes. The second one does not work on Windows, although there is a Docker image available. The first one is both a library and command-line tool, while the second one is a command-line tool.
You might also want to look at Excalibur, a web interface for Camelot. This can be quite useful given that the process is inherently non-deterministic. So you can use Excalibur to allow an average user to check and eventually tinker with the detection of the table in a PDF to improve the final result.
Installation Notes
In summary you have to install:
- OCRmyPDF, to use OCR on PDFs containing images
- Camelot, to detect the tables inside PDFs
- Excalibur, if you want a web interface for Camelot
The links point at the installation instructions contained in the respective documentation. This is where you should look to find out precise information on how to install these software and all their dependencies for your platform. Here we just mentioned a few notes related to our experience.
If you want install Camelot with pip:
- it is
camelot-pyand notcamelot - Python tools are not that good: they do not really ensure all dependencies are present. So a software that frequently you have to manually install is OpenCV. You can do that with
pip install opencv-python
For OCRmyPDF, remember to install all the tesseract language packs you will need for your use case. And also consider that the version in the repository of your distribution might be severely outdated.
Let’s Make Sure There is Some Text
The first step is to make sure there is some text into the PDF, by using OCRmyPDF. If you only have either full scanned images PDF or fully textual PDFs you can safely call the tool on each PDF. When a PDF contains just images you will get an annotated PDF, otherwise you will get this error message.
ocrmypdf -l eng --rotate-pages pdfs/Eurostat_Immigration.pdf pdfs/Eurostat_Immigration_OCR.pdf
  ERROR -    1: page already has text! – aborting (use --force-ocr to force OCR)
If your PDFs mixes scanned images with text, you should use the options --skip-text that ignores pages with digital text in it.
Basic Options
The tools have a few useful options for processing images and some that are both useful and potentially dangerous. The second ones are dangerous if you want to also archive the OCR-ed PDF files. The options that you can always use are:
--rotate-pagestries to determine the correct orientation for each page and rotates the page if necessary--deskewwill correct the inclination of pages scanned. This option might result in larger output files, because the images are altered.--cleanuses unpaper (a tool to improve readability for scanned images) to clean up pages before OCR, but does not alter the final output. This makes it less likely that OCR will try to find text in background noise create by the OCR process.--mask-barcodeswill suppress any barcodes detected in a page image just for the OCR recognition. Barcodes can confuse Tesseract. The output file will contain the unaltered image of the barcode.
The options that can be dangerous are --clean-final and --remove-background. The first one simply saves the result of clean in the output file. The second one tries to remove noisy backgrounds. It can accidentally remove color images.
Another useful option is -l to indicate the language of the text. The correct language can improve recognition, while the wrong one can hinder it. The default language is English. You can also indicate multiple languages concatenating them with a + symbol.
ocrmypdf -l eng+ita pdfs/European_elections_turnout.pdf pdfs/European_elections_turnout_ocr.pdf
The Output File
The final important note is that the default output file created by OCRmyPDF is in the PDF/A format. This is a variant of the PDF format designed for archiving and long-term storage. In practical terms this means that some features, like font linking, are forbidden.
In addition you should know that OCRmyPDF will perform some optimizations on the images contained in the file, even if no text is found. I prefer to disable these optimizations by setting --optimize 0. This will create larger files.
A Simple Script
There is much more to learn about batch processing and advanced features in the documentation. However, this is our basic Python script that we use for this step.
import os
import subprocess
import sys
import camelot

script_dir = os.path.dirname(os.path.realpath(__file__))
print(script_dir + '/pdf_to_excel.py: Start')

if len(sys.argv) > 1:
    start_dir = sys.argv[1]
else:
    # we will process the current directory
    start_dir = '.'

for dir_name, subdirs, file_list in os.walk(start_dir):
    os.chdir(dir_name)
    for filename in file_list:
        file_ext = os.path.splitext(filename)[1]
        if file_ext == '.pdf':
            full_path = dir_name + '/' + filename
            # let's try to find some text into the PDF
            print("attempting to OCR: " + full_path)
            # add --deskew only if we are sure that the images might need it
            # because it might create large file together with the option --optmize 0
            cmd = ["ocrmypdf",  "--skip-text --deskew --rotate-pages --clean --optimize 0", '"' + filename + '"', '"' + os.path.splitext(filename)[0] + "-OCR.pdf""]

            # you should run OCRmyPDF as a command line tool
            # see https://ocrmypdf.readthedocs.io/en/latest/batch.html#api
            proc = subprocess.run(
                cmd, stdout=subprocess.PIPE, stderr=subprocess.STDOUT)
            result = proc.stdout

            if proc.returncode == 0:
                print("OCR complete")
            elif proc.returncode == 6:
                print("The file already contains text")
            else:
                print("Error")
Quality of the Results
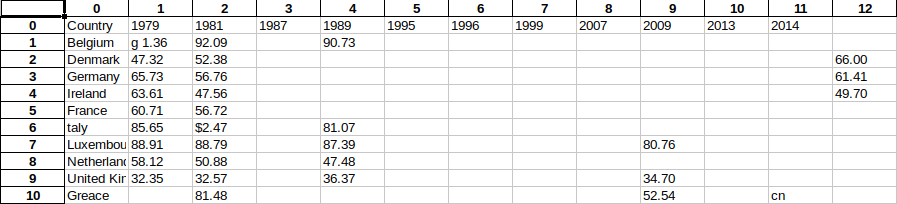
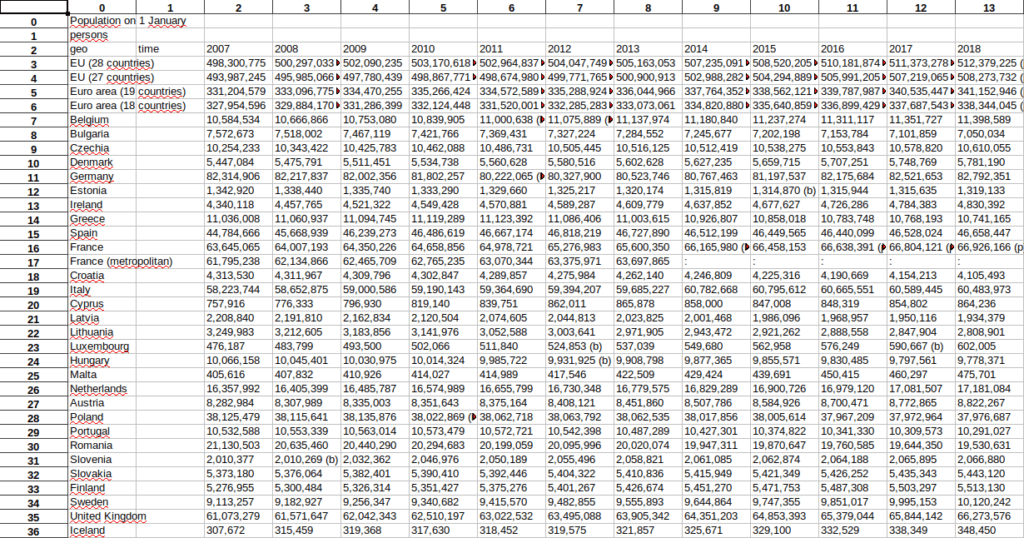
We have seen that the process to OCR an image is quite easy. How good are the results? Well, they are decent, but never perfect in our experience. We have tried to get the OCR from this image which was turned directly in a PDF and not printed and scanned.
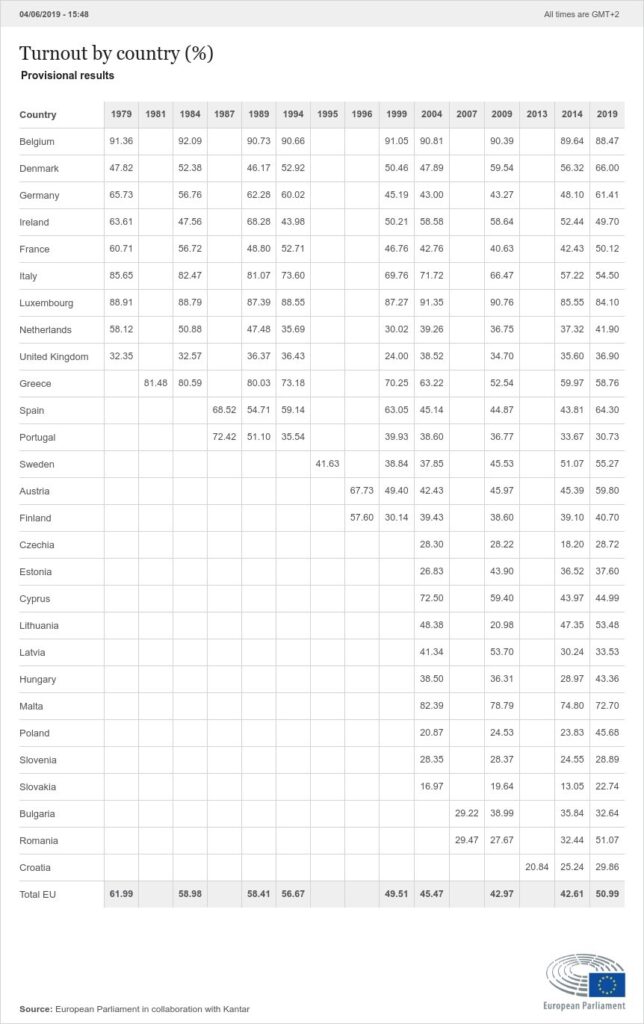
The quality of the image is not perfect, but even so this is the best case scenario because the image is not scanned, but directly the digital version.
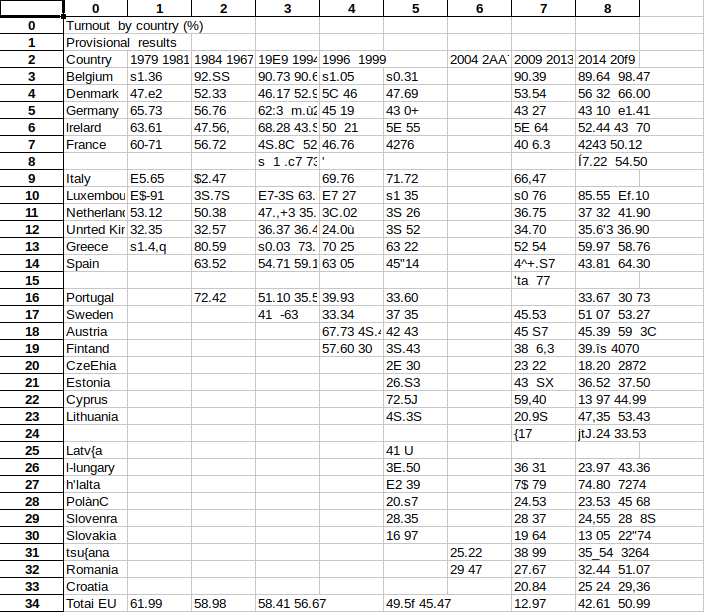
This is how the Excel file, at the end of the process, looks like.
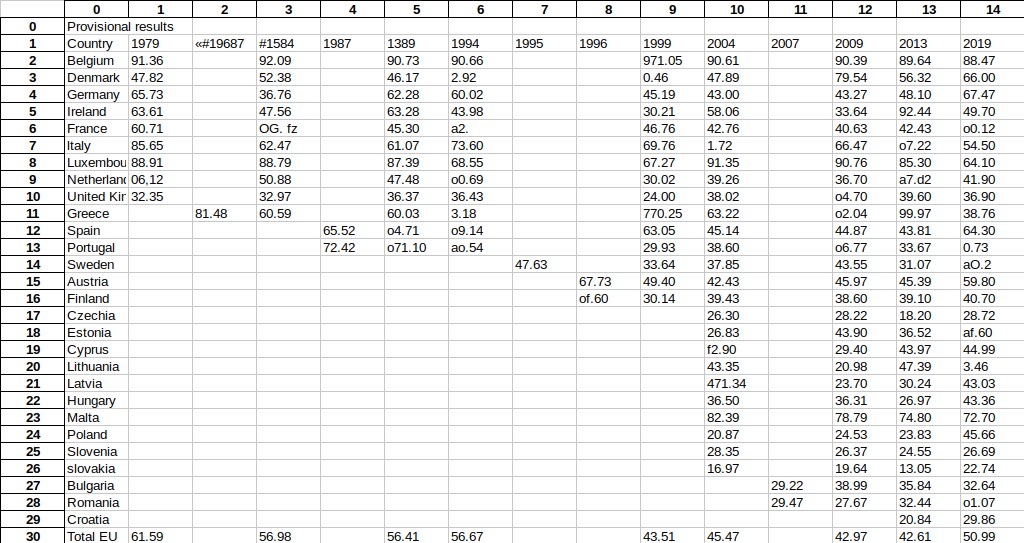
As you can see the real problem are numbers, words tend to be fine if you have the right language. That is because with text the OCR engine can get clues on which characters are more likely, so it can reduce mistakes. Instead there is no correction algorithm for numbers, so there might be several problems with them.
What About Scanned Images?
The results with the same image printed and scanned are simply not good enough to be that useful.
The results are much better when using a simple commercial OCR software, something that would come with a recent scanner. Such a software annotates the PDF, much like OCRmyPDF would, if you saves the scanned image as PDF.
Despite being better, these results are still hardly useful.
In fact, there are so many mistakes that each file will have to be reviewed manually to correct errors and add missing parts. Frankly detecting tables from images is still hard to do, mainly because of the quality of OCR. If your tables are trapped in images you will have to get deep in tesseract to optimize the process. The alternative is to find a commercial software that could replace OCRmyPDF with better results.
Honestly we are not sure if there is an OCR software good enough for the task. We do not know whether improving the quality of the scanned image to the best quality available with professional scanner will improve the results. As we said, we are not sysadmins. What we can say is that, with the means available to the average user, the results of this step are still bad enough to make the process clunky and slow.
Extracting the Tables
Now that we are sure to have some text, we can try to extract the tables from the file.
As we said previously, Camelot could be used both as a command-line tool and a library. We prefer using it as library because it allows to make some checks on the results.
The basic command is quite easy.
tables = camelot.read_pdf('pdfs/Eurostat_population.pdf', pages='1-end')
We feed the input file and an option to indicate the pages where to look for tables. This is necessary because by default Camelot only search in the first page. By default it also uses the lattice method to detect for tables.
This command will extract some tables, but the process can be improved with some tweaks.
Comparing Results for Both Methods
The obvious first move is to try to detect tables with both methods and then select the best result. The trick is to understand how determine which one is the best result. At first this seems easy because Camelot returns an object that contain accuracy and whitespace values for each table found. The higher the accuracy is and the lower the whitespace is the better is the result.
print tables[0].parsing_report
{
    'accuracy': 99.02,
    'whitespace': 12.24,
    'order': 1,
    'page': 1
}
We says that this seems easy because these values do not accurately reflect the quality of the results. They should mostly be taken as a filter, rather than as absolute measures of value. We mean that if the accuracy is high enough and the whitespace low enough you got a good enough result. However, a result with 100% accuracy might not actually be better than one with 98%. And also an accuracy of 100% does not mean that it detected 100% of the original table.
For instance, with a sample file, containing data about the EU population from Eurostat, the lattice method seemed to have the best result.
{'accuracy': 100.0, 'whitespace': 2.04, 'order': 1, 'page': 1} # lattice
{'accuracy': 99.99, 'whitespace': 10.36, 'order': 1, 'page': 1} # stream
However in reality the stream method recognized perfectly the whole table, while the lattice method recognized just the first column. This means that you should check the shape field of the Table object, like this.
print(lattice_tables[0].shape) # => (49, 1)
print(stream_tables[0].shape) # => (51, 14)
So the table with the most columns and rows is the best, isn’t it? Well yes. However, this does not solve a new problem that arises when you have multiple tables in one file.
Choosing the Best Results with Multiple Tables
Since you get a quality report for each table, you could find that the best result for the first table comes from the lattice method, while the best for the second table comes from the stream method.
The issue that you could get a different number of tables with for each method. A method could fail to recognize one table that the other one found out. You could guess whether the N-th table found with the stream method and the N-th table found with the lattice are the same by looking at the other fields order and page. However, this is error-prone, you could never be sure if they really are the same table.
In practice you would have to create some heuristics to be sure both that two table objects refers to the same actual table and to find the best table between the two. If the size of the collections of tables found by the two methods are different, you would have to make a choice: you could keep both of them or just pick the one with the most tables.
A Basic Script
We put together these considerations in our basic version of these heuristics.
    # we check for tables with both methods
    lattice_tables = camelot.read_pdf(new_filename, flavor='lattice', pages='1-end')
    stream_tables = camelot.read_pdf(new_filename, flavor='stream', pages='1-end')

    # the final tables
    tables = []

    # we check whether the number of tables are the same
    if len(lattice_tables) > 0 and len(stream_tables) > 0 and len(lattice_tables) == len(stream_tables):
        # then we try to pick the best table
        for index in range(len(lattice_tables)):
            # we check whether the tables are both good enough
            if is_good_enough(lattice_tables[index].parsing_report) and is_good_enough(stream_tables[index].parsing_report):
                # they probably represent the same table
                if lattice_tables[index].parsing_report['page'] == stream_tables[index].parsing_report['page'] and lattice_tables[index].parsing_report['order'] == stream_tables[index].parsing_report['order']:
                    total_lattice = 1
                    total_stream = 1

                    for num in lattice_tables[index].shape:
                        total_lattice *= num
                    for num in stream_tables[index].shape:
                        total_stream *= num

                    # we pick the table with the most cells
                    if(total_lattice >= total_stream):
                        tables.append(lattice_tables[index])
                    else:
                        tables.append(stream_tables[index])

            # if we have a different number of tables we just pick the object with the most number of tables
            elif is_good_enough(lattice_tables[index].parsing_report):
                tables.append(lattice_tables[index])

            elif is_good_enough(stream_tables[index].parsing_report):
                tables.append(stream_tables[index])
    elif len(lattice_tables) >= len(stream_tables):
        tables = lattice_tables
    else:
        tables = stream_tables

    if tables is not None and len(tables) > 0:
        # let's check whether is TableList object or just a list of tables
        if isinstance(tables, camelot.core.TableList) is False:
            tables = camelot.core.TableList(tables)
        tables.export('population.xls', f='excel')
To get the best tables:
- we first check whether the two group of tables contain the same number of tables. If not, we pick the group with the most number
- if the groups have the same number of tables, we iterate through each of them
- we first make sure that they are both good quality tables. This can be done by checking their accuracy and whitespace values
- we then determine whether the two
Tableobjects probably refes to the same real table. We do that by verifying that they are in the same page and they are in the same order in the page. Anorderof 1 means that it is the first table in the page, anorderof 2 means that is the second table in the page, etc. - finally we put together the list of tables in a
TableListobject. We do that so that we export the tables in one Excel file.
Use Camelot Options to Improve the Result
We have seen the process of extracting tables from Camelot, now we are going to see how we can tweak it.
Camelot has many advanced options, that can be used to improve the extraction of a table. However, they are hard to use through the command line. They are used to do stuff like visual debugging, to follow step-by-step the elements found by Camelot to improve recognition of a table. Most of them are best used through a graphical interface, like the aforementioned Excalibur.
Size Matters
tables = camelot.read_pdf('pdfs/Eurostat_Population.pdf', flag_size=True)
One that you can use even within a script is flag_size. This option will enclosed any text that is smaller than the rest of the cell inside a <s> tag. This is useful to isolate notes, which is very important when they are linked to numbers. Like in the following example image, coming from the Camelot documentation.
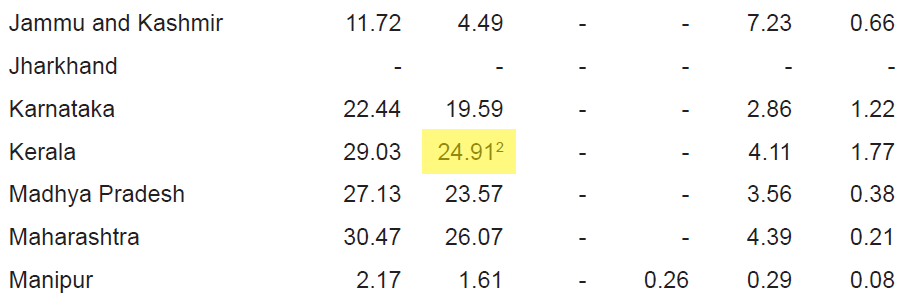
Without this option you table might contain wrong numbers. In this example, the highlighted cell would contain 24.912 instead of 24.91. This is a small difference here, but it can be bigger elsewhere.
Improving Tables Recognition
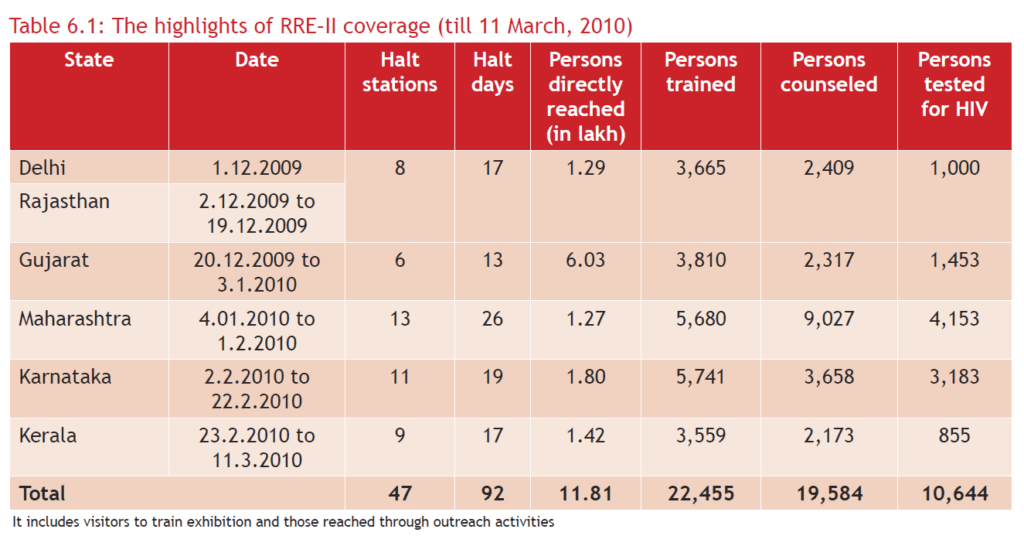
tables = camelot.read_pdf('pdfs/Eurostat_Population.pdf', process_background=True)
Another useful option is process_background. Camelot usually only consider lines in the foreground for its detection. Instead this option force Camelot to evaluate them, too. This can improve recognition of tables when using the lattice method. This is useful for this example, coming from the Camelot documentation.
We tested this option with our example PDF of the EU population from Eurostat. It did improve recognition with the lattice method. However, this method still missed some rows in the table. So, it was not enough to get a perfect recognition.
Dealing with Password Protected PDFs
tables = camelot.read_pdf('pdfs/Eurostat_Population.pdf', password='Sshh!Secret!')
Finally, if your PDFs are encrypted you might use the option password to access the file. Notice that Camelot supports only some encryption algorithms.
Currently Camelot only supports PDFs encrypted with ASCII passwords and algorithm code 1 or 2. An exception is thrown if the PDF cannot be read. This may be due to no password being provided, an incorrect password, or an unsupported encryption algorithm.
So you might have to use a tool like QPDF to remove the password altogether before processing it.
Exporting the Tables Found
Now that we hopefully have some good quality tables, we can save the tables found in an Excel file.
tables.export('population.xls', f='excel')
Well, that was easy. Camelot also support exporting the tables to the CSV, JSON and HTML formats. If you plan to export to any of these other formats you might want to use the option compress. This groups all the exported tables inside a zip file. This is not necessary for Excel files, because in an Excel file each table has its own sheet.
The table extracted for our example file from Eurostat is perfect.
Summary
Converting tables inside PDF files into Excel files is certainly feasible when the tables are textual. The process is not perfect even in that case (see an analysis on some example files), but it works well enough. You still need a manual review of the files created but after some testing and tweaking you should get reliable results.
It is a whole different thing when dealing with tables obtained from images. In these cases you can only use one method to recognize tables, so you start with less power. However the main issue is OCR recognition, which is simply not good enough in many cases. This is especially a problem with numbers, for which the software has no way to to automatically detect mistakes by knowing the language in which the document is written.
If you can find a way to access better OCR recognition than what is accessible to the average consumer, you might solve this issue, too. Otherwise the mistakes are so many that you should consider recognizing tables from PDF images mostly as a manual process. The tools in this article can certainly speed up the process, but you will have a lot of manual work to do.
")
